

How bad is Riyad Mahrez at penalties?
Penalties
As soon as Riyad Mahrez missed his penalty against Liverpool, the commentators were already questioning whether he was the right man to have taken it. After-timing aside, do they have a point? He had missed his previous 2 attempts, is there anything we can learn from this or is it too small a sample size?
Averages
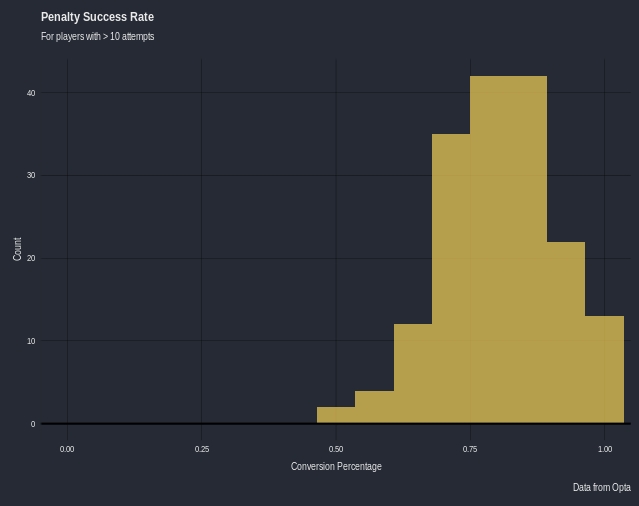
The table below shows the breakdown of all the penalties in my database.
| Outcome | % |
|---|---|
| Goal | 0.757 |
| Miss/Save | 0.243 |
Prior to his Liverpool penalty Mahrez had a conversion percentage of 64.3% from 14 penalties. Is this enough information to suggest he is bad at penalties?
Player conversion
By grouping the penalties by player they were taken by we can look at player conversion, the table below shows the 5 players who have taken the most penalties in the dataset.
| Player | No. Pens | Conversion % |
|---|---|---|
| Cristiano Ronaldo | 86 | 0.826 |
| Lionel Messi | 57 | 0.789 |
| Zlatan Ibrahimovic | 55 | 0.873 |
| Edison Cavani | 44 | 0.75 |
| Sergio Aguero | 39 | 0.769 |
The mean conversion for a player is 69.4%, there is a lot of players in the dataset who have taken only 1 penalty (1041 out of 2494 players)
Modelling
We have $$N$$ players in the dataset, each player $$n \in N$$ has $$y_{n}$$ goals (successes) out of $$k_{n}$$ penalty attempts (trials).
Assumptions
- Penalty taking is a skill.
- Each players penalty attempts are independent Bernoulli trials.
Complete Pooling
We model each penalty as having the same chance of success $$\phi \in [0,1]$$. Using stan (code at the bottom of post), we can fit a model in R.
R Code
N <- dim(df)[1]
K <- df$K
y <- df$y
M <- 10000;
fit_pool <- stan("pool.stan", data=c("N", "K", "y"),
                 iter=(M / 2), chains=4);

ss_pool <- rstan::extract(fit_pool);
print(fit_pool, c("phi"), probs=c(0.025, 0.5, 0.975));
Inference for Stan model: pool.
4 chains, each with iter=5000; warmup=2500; thin=1;
post-warmup draws per chain=2500, total post-warmup draws=10000.
mean se_mean sd 2.5% 50% 97.5% n_eff Rhat
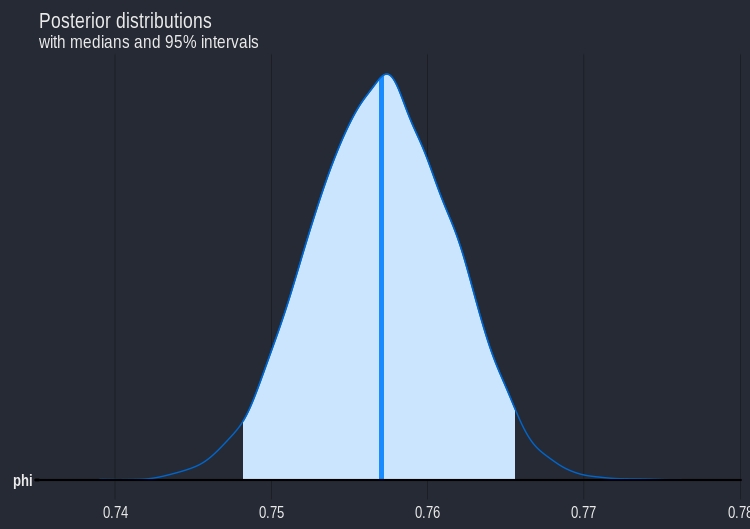
phi 0.76 0 0 0.75 0.76 0.77 3398 1
We get a posterior mean of 0.76 with a 95% central posterior interval of (0.75,0.77). Intuitively it feels wrong to assume that each player has the same chance of scoring a penalty, but the complete pooling model is a good starting point.
Partial Pooling / Hierachal Modelling
We assume that each player is part of a population, i.e penalty takers. The properties of the population as a whole are estimated, as are that of the player. Uncertainty based off the different number of attempts for each player will be accounted for.
I used a non-centred, log-odds parameterization (as there are a lot of players with few attempts). Full code is at the bottom of post.
R Code
fit_hier_logit <- stan("hier_logit_nc.stan", data=c("N", "K", "y"),
                       iter=(M / 2), chains=4,
                       control=list(stepsize=0.01, adapt_delta=0.99));
ss_hier_logit <- rstan::extract(fit_hier_logit)
print(fit_hier_logit, c( "mu", "sigma"), probs=c(0.1, 0.5, 0.9));
Inference for Stan model: hier_logit_nc.
4 chains, each with iter=5000; warmup=2500; thin=1;
post-warmup draws per chain=2500, total post-warmup draws=10000.

      mean se_mean   sd  10%  50%  90% n_eff Rhat
mu    1.13       0 0.03 1.10 1.13 1.17 13061 1.00
sigma 0.18       0 0.09 0.06 0.19 0.29   676 1.01
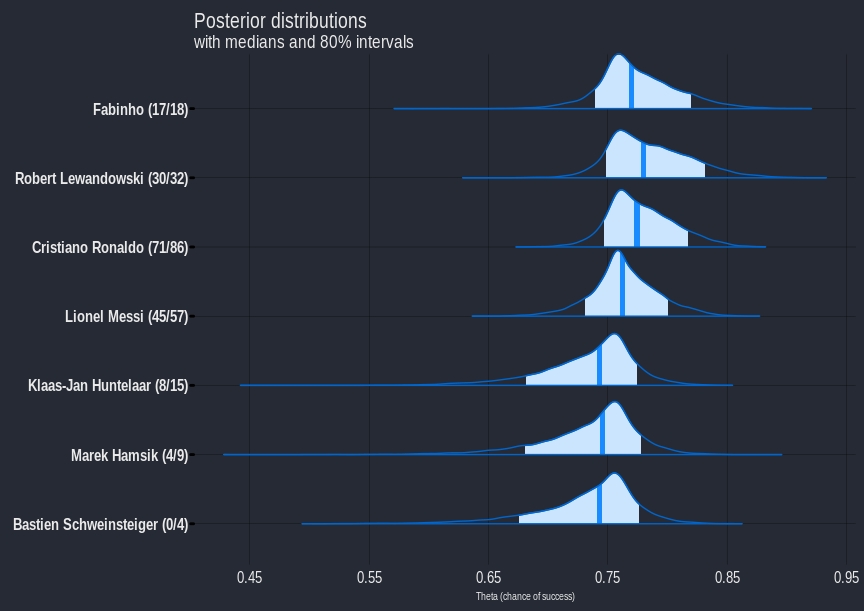
We can convert the fitted parameters back into chance of success, the plot below shows a subset of players.
Improvements
By just using the total number of successes $$y_{n}$$ out of $$k_{n}$$ attempts, information is being lost. By modelling each penalty as a success or failure, and considering the goalkeeper, we can add information and hopefully improve the model.
Assumptions
- Penalty taking and penalty saving are skills.
- Each players penalty attempts are independent Bernoulli trials.
- Each goalkeepers penalty save attempts are independent Bernoulli trials.
- The players ability do not vary with respect to time.
Model
Each penalty is modelled as an event that depends on both the penalty takers skill and the goalkeepers skill.
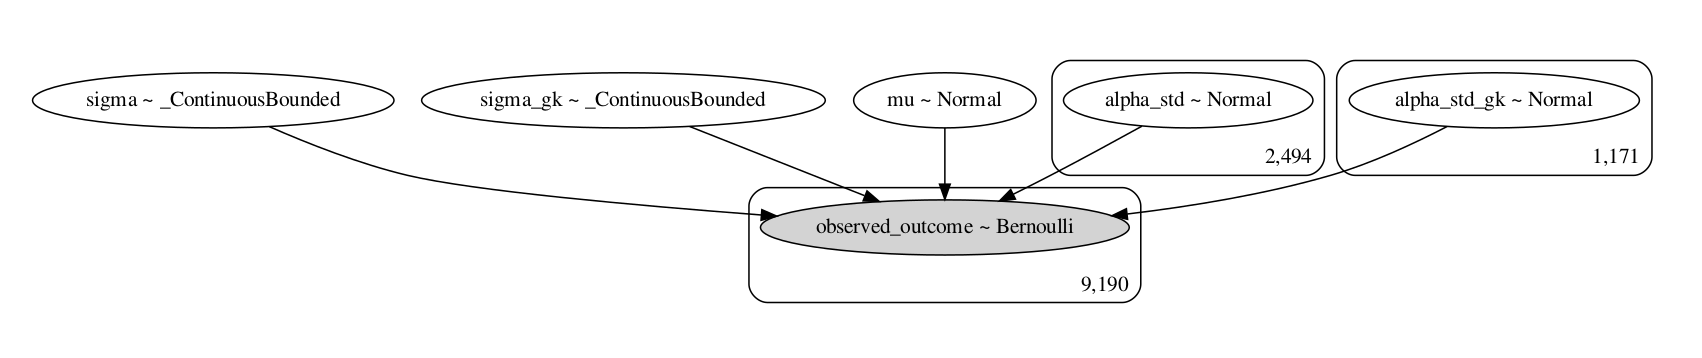
I chose to fit the final model using pymc3, using the code shown at the bottom.
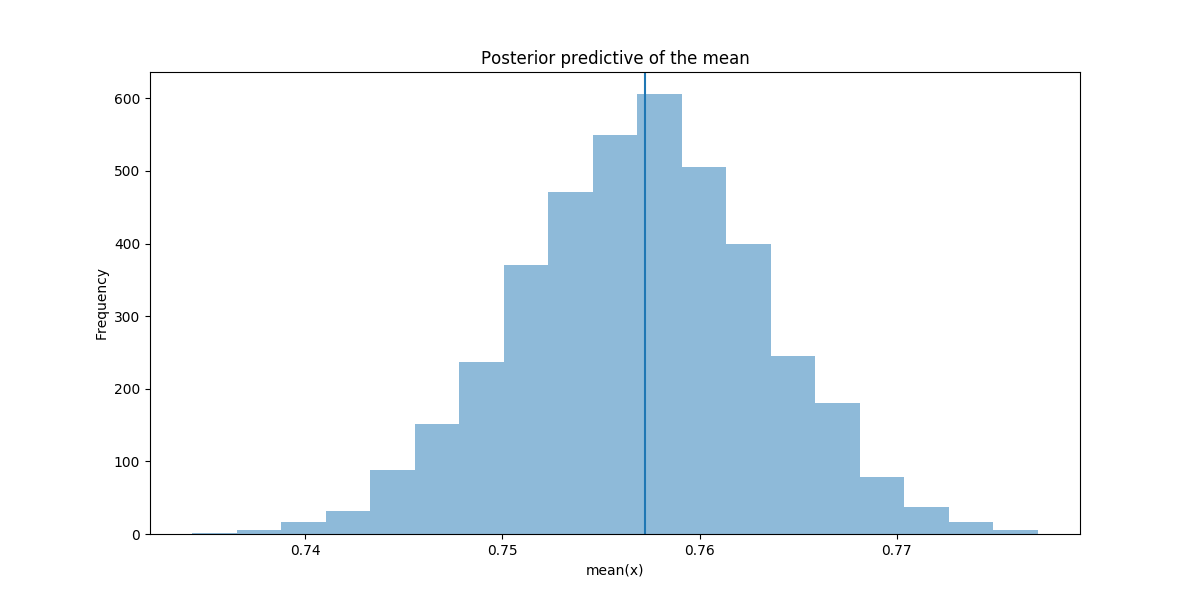
The inferred means from the final model are close to the actual sample mean as shown by the following plot.
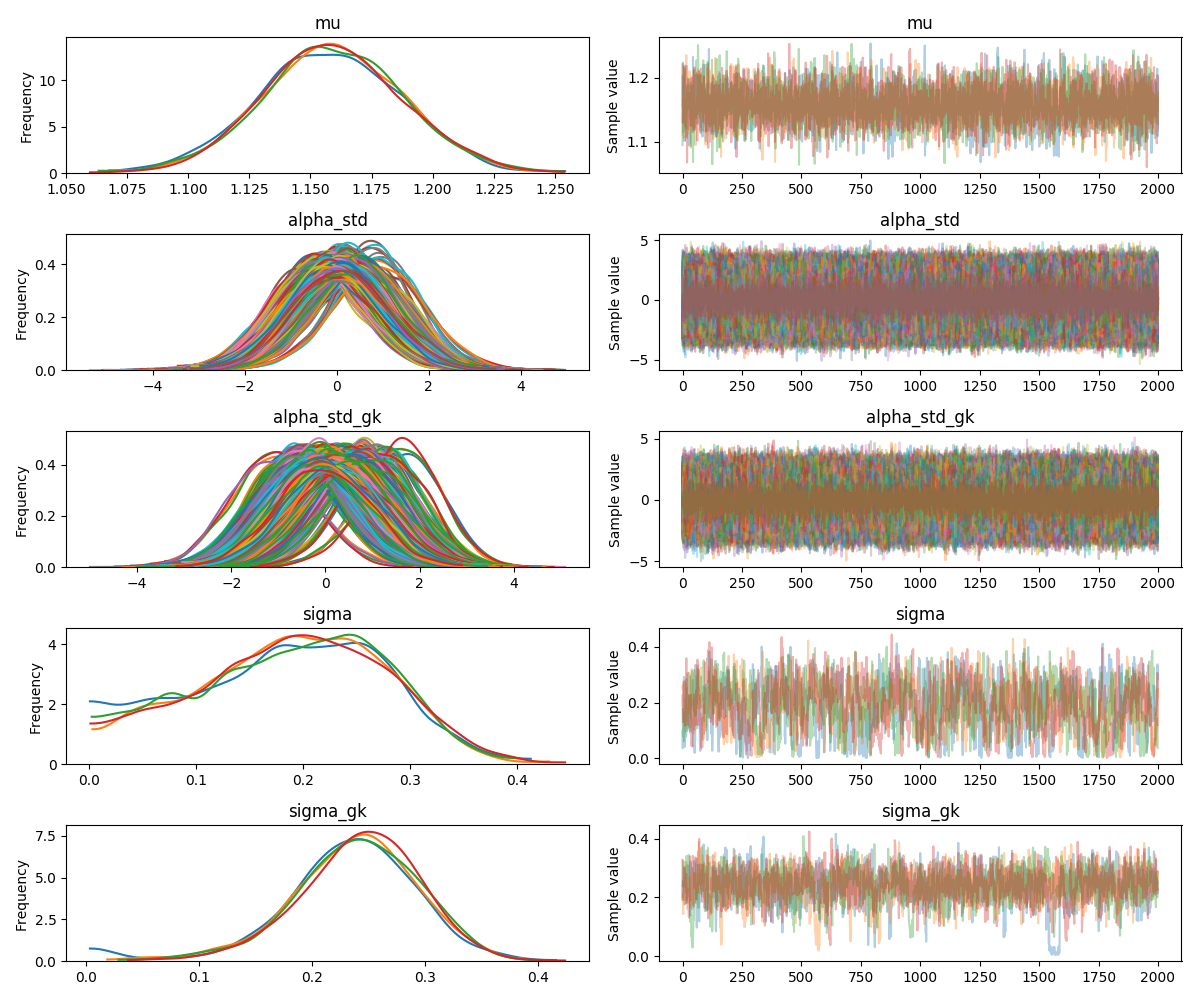
The traceplot for the final model is also shown. The plots for alpha_std and alpha_std_gk are busy as these are the parameter estimates for each player, and there are a lot of players in the dataset.
Extracting the taker and goalkeeper ratings and plotting gives the following.
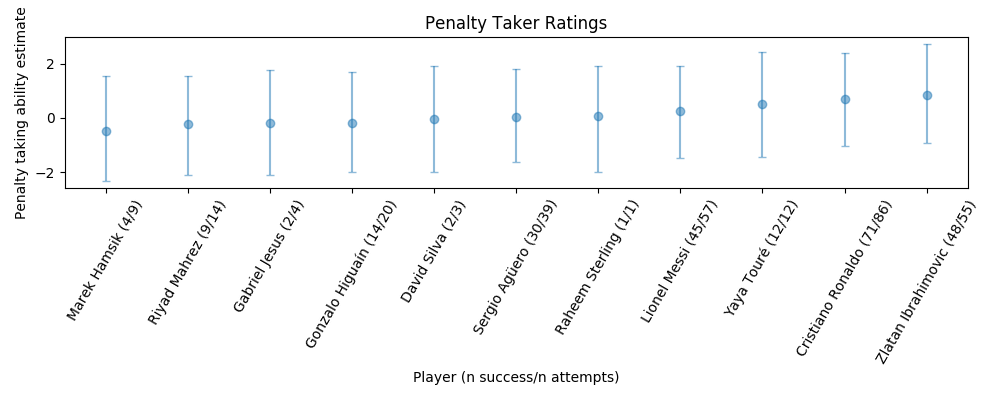
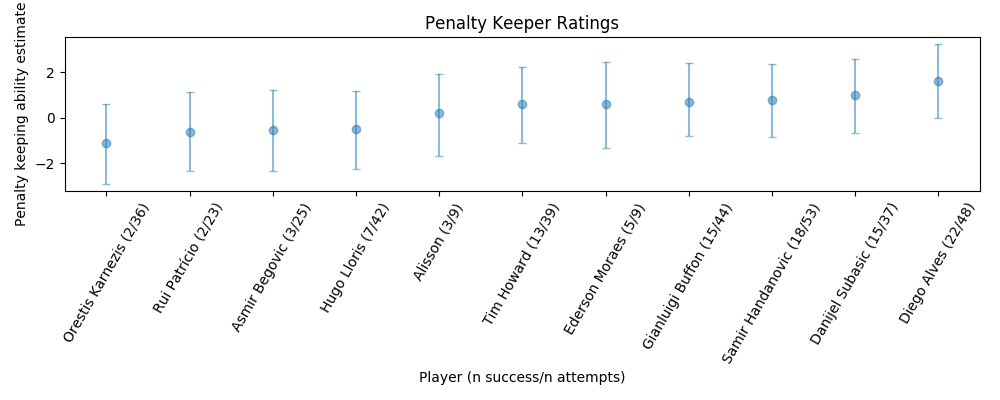
There is still a lot of uncertainty in the estimates for both takers and keepers, even for those with a large number of attempts.
Predictions
We can calculate an estimate for the probability of scoring the penalty for the Manchester City players vs Alisson.
| Player | % |
|---|---|
| Mahrez | 0.745 |
| Jesus | 0.746 |
| Aguero | 0.755 |
Aguero was not on the pitch at the time of the penalty, and using the fitted model, there is minimal difference between Mahrez and Jesus taking the penalty.
Issues / Further improvements
- When a penalty is missed, the taker is punished and the goalkeeper is rewarded. If a player scuffs their shot or completely mishits a penalty is the goalkeeper partly responsible?
- Does home advantage have any effect on penalty taking?
- Does game state/ penalty shootout order affect the probability of success?
- Can penalty placement data be incorporated to improve modelling? (There is co-ordinate data for where the ball crosses the goalmouth plane)
- Is it okay to assume penalty taking/saving ability stays constant with regards to time? Do players get better at taking penalties the more experience they gain?
- Does penalty taking ability correlate with a players finishing ability?
- Look at re-parameterizing or optimizing to minimize prediction error on a new penalty taker/goalkeeper. (Would a player with no history of penalty taking have had a higher probability of scoring than Mahrez/Jesus?)
Stan Code (Complete Pooling)
data {
  int<lower=0> N;           // number players
  int<lower=0> K[N];        // attempts (trials)
  int<lower=0> y[N];        // goals (successes)
}
parameters {
  real<lower=0, upper=1> phi;  // chance of success (pooled)
}
model {
  y ~ binomial(K, phi);
}
Stan Code (Partial Pooling)
data {
  int<lower=0> N;           // number players
  int<lower=0> K[N];        // attempts (trials)
  int<lower=0> y[N];        // goals (successes)
}
parameters {
  real mu;                       // population mean of success log-odds
  real<lower=0> sigma;           // population sd of success log-odds
  vector[N] alpha_std;           // success log-odds
}
model {
  mu ~ normal(1, 1);                             // hyperprior
  sigma ~ normal(0, 1);                           // hyperprior
  alpha_std ~ normal(0, 1);                       // prior
  y ~ binomial_logit(K, mu + sigma * alpha_std);  // likelihood
}
generated quantities {
  vector[N] theta;    // chance of success
  for (n in 1:N)
    theta[n] = inv_logit(mu + sigma * alpha_std[n]);
    //calculate success for non centred parameterization
}
Python Code
with Model() as final_model:
    mu = Normal('mu', 1, 1, shape=1)
    BoundedNormal = Bound(Normal, lower=0.0)
    sigma = BoundedNormal('sigma', mu=0, sd=1, shape=1)
    sigma_gk = BoundedNormal('sigma_gk', mu=0, sd=1, shape=1)
    alpha_std = Normal('alpha_std', 0, 1, shape=len(takers))
    alpha_std_gk = Normal('alpha_std_gk', 0, 1, shape=len(keepers))
    p = tt.nnet.sigmoid(mu + sigma*alpha_std[obs_tak] - sigma_gk*alpha_std_gk[obs_keep])
    Bernoulli('observed_outcome', p=p, observed=obs_wl)

with final_model:
    trace = sample(2000, tune=1000, nuts_kwargs={'target_accept': 0.95})

Leave a Comment