
Expanding on Opta’s venue data
Why
Opta provide weather code’s for matches that give basic weather information, I decided to try and add futher data to that.
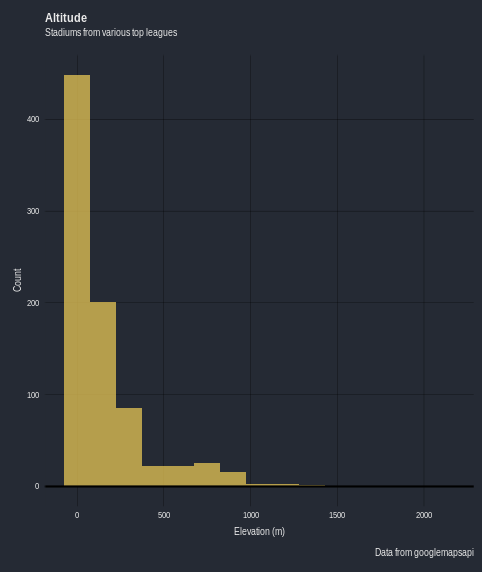
Location
To get weather data you need location information, using the (google maps api) we can get longitude, latitude and altitude data for stadiums. Below is a quick histogram of the some location data (altitude) of stadiums. Colorado Rapid’s ground “Dick’s Sporting Goods Park” was the highest stadium in my database with an elevation of roughly 1,600m, for quick comparison Bolivia’s infamous Estadio Hernando Siles has an elevation of 3,637m.
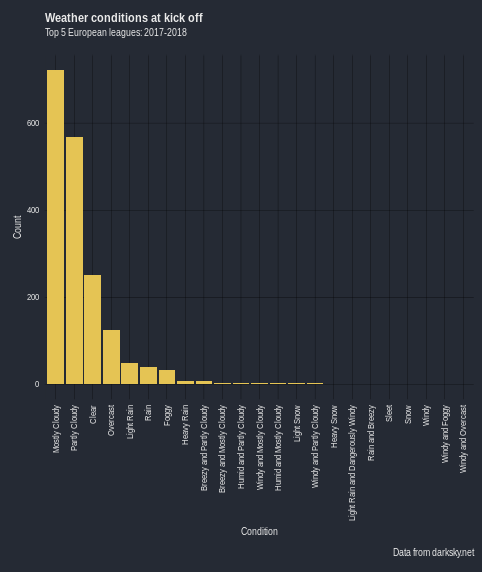
Temperature
Weather data can now be collected using the (darksky api) Below you can see some temperature and weather condition data. The coldest game for 2017-18 was Dortmund vs Augsburg on the 26th February 2018, with the temperature being -4.58°C and the warmest being Leganes vs Alaves on the 18th August 2017 with the temperature being 33.3°C.

Pitch Size
Using various wikipedia python packages you can add data (very unclean data) from infoboxes. Below you can see pitch dimension data for some Premier League stadiums (accuracy unknown).

Further Analysis
Things I intend to look at if I get the time.
- Validation - Original temperature plot had a premier league game kicking off in -25°C (issues with ambiguous venue names with googlemapsapi)
- Effect of weather/temperature on various football events.
- Effect of pitch size/surface on various football events (wikipedia data needs cleaning and verifying properly first)
Code used for above and visualizations is (here)
Leave a Comment