

How much is a penalty really worth?
(Data from Opta.)
Conventional Wisdom
The public analytics community as a whole assign a value of 0.76 XG (XG explained) to a penalty. Is this correct?
(Disclaimer: I will not be going into the issue of whether or not penalties should be included in single game summaries or timelines)
Origin
With a large dataset it is easy to calculate a quick estimate for the probability of a penalty resulting in a goal. Looking at the outcome of penalties awarded below, excluding penalty shootouts (they’re converted at a different rate), we can see where the widely used figure of 0.76 comes from.
| Type | Total | % |
|---|---|---|
| Goal | 6340 | 0.7596 |
| Saved | 1492 | 0.1788 |
| Missed | 289 | 0.0346 |
| Post | 225 | 0.0270 |
Improvement
I was watching a game recently and this happened. How often do these kind of chances arise, and how likely are they to result in goals?
<iframe width="560" height="315" src="https://www.youtube.com/embed/QLkQ_SdO0a8?rel=0&showinfo=0" frameborder="0" allow="autoplay; encrypted-media">Penalty Rebounds
Definition
I denote a shot to be a penalty rebound if:
The shot occurs directly after a penalty that is either saved or hits the post. It is the first action taken by the same team after the penalty (i.e no passes made).
I also chose to log the time between the taking of the penalty and the penalty rebound for sanity checking purposes.
Validation
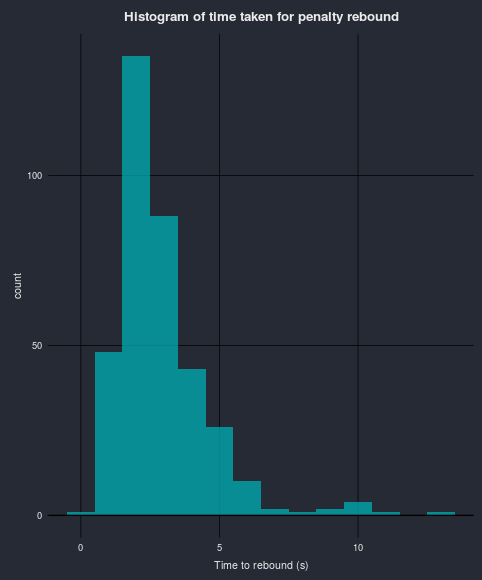

There is a total of 368 “penalty rebounds” in my dataset. Looking at the histogram above, the majority of the “time_to_rebound’s” fall within a reasonable bound, there are a few entries > 10 seconds that look suspicious. Looking at one of the entries with a large time_to_rebound (11 seconds), a penalty rebound does occur and the actual “time_to_rebound” is less than the 11 seconds.
<iframe width="560" height="315" src="https://www.youtube.com/embed/8D4ZklbHLrw?rel=0&showinfo=0&start=57" frameborder="0" allow="autoplay; encrypted-media" allowfullscreen>The locations of the rebounds intuitively make sense too, however there are a few points around the x=70 position that look questionable. Once again looking at a rebound with one of the most extreme x co-ordinates (x=71, y=58), we can be confident that this fits the description of a penalty rebound.
<iframe width="560" height="315" src="https://www.youtube.com/embed/bQ_RyKO6XIw?rel=0&showinfo=0&start=27" frameborder="0" allow="autoplay; encrypted-media" allowfullscreen>Summary Statistics
Looking at the whole set of penalty rebounds gives the summary statistics below.
| # | Mean XG/shot | Mean Goals/shot | Mean error | Mean absolute error | RMSE |
|---|---|---|---|---|---|
| 368 | 0.33 | 0.42 | 0.089 | 0.35 | 0.42 |
(Mean absolute error & RMSE explained)
I was surprised by the errors between the model predictions and the actual outcome of the penalty rebounds. I was expecting them to be much greater, due to:
- Keeper being grounded, or very recently grounded.
- Much less likely for defenders to be in-between the shooter & the goal than any other normal shot.
Improvement
I re-trained the XG model using penalty rebound as a feature (368 shots out of a total of over 70,000 shots). The newly trained model predicted a mean XG per shot of 0.38 for the penalty rebounds, and had a minuscule improvement over the old model in terms of its RMSE for both the penalty rebound shots, and also all shots. Summary statistics for the new model are shown below.
| # | Mean XG/shot | Mean Goals/shot | Mean error | Mean absolute error | RMSE |
|---|---|---|---|---|---|
| 368 | 0.38 | 0.42 | 0.037 | 0.35 | 0.41 |
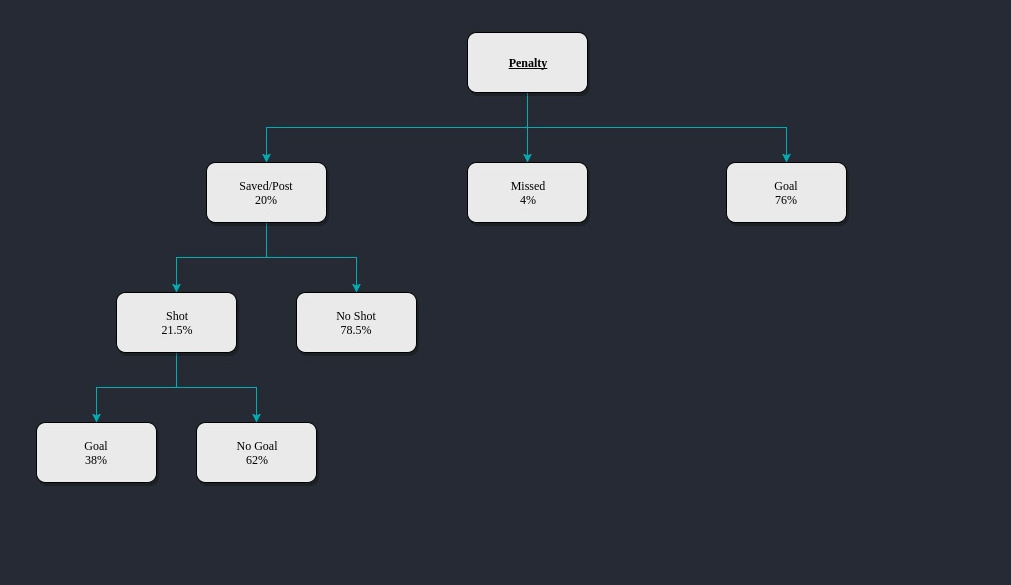
Following the tree above, and using the XG model value of 0.38 for a penalty rebound, a penalty results in a goal in 78% of occurrences.
0.76 + (0.2 x 0.215 x 0.38) = 77.6%
Note
Using 0.78 as the estimated value for a penalty awarded only makes sense if any shots that would be classified as a penalty rebound are removed too.
Leave a Comment